


The data below is based on the recruitment period 2017-2021 for the GW4-CAT PhD Programme.
Applicants by Intake Year
| 2017-2018 | 2018-2019 | 2019-2020 | 2020-2021 | 2021-2022 | Total | |
| Applications Received | 35 | 38 | 24 | 25 | 38 | 160 |
| Applicants Appointed | 4 | 5 | 6 | 4 | 3* | 22(+1) |
| Applications Per Place | 8.75 | 7.60 | 4 | 6.25 | 12.67 | 7.27 |
*Plus 1 fellow from 2022-23 recruitment round
Applicants by Discipline
| Total | Percentage | |
| Dental | 13 | 8% |
| Medical | 116 | 73% |
| Veterinary | 31 | 19% |
| Total | 160 | 100% |
Applicants by Gender
| Application | Interview | Offer | |
| Female | 52% | 50% | 57% |
| Male | 48% | 50% | 43% |
| Other | 0% | 0% | 0% |
Applicants by Ethnicity
| Application | Interview | Offer | |
| BAME | 33% | 30% | 26% |
| White | 63% | 67% | 70% |
| Prefer not to say | 4% | 4% | 4% |
Total Applicants by Specialty
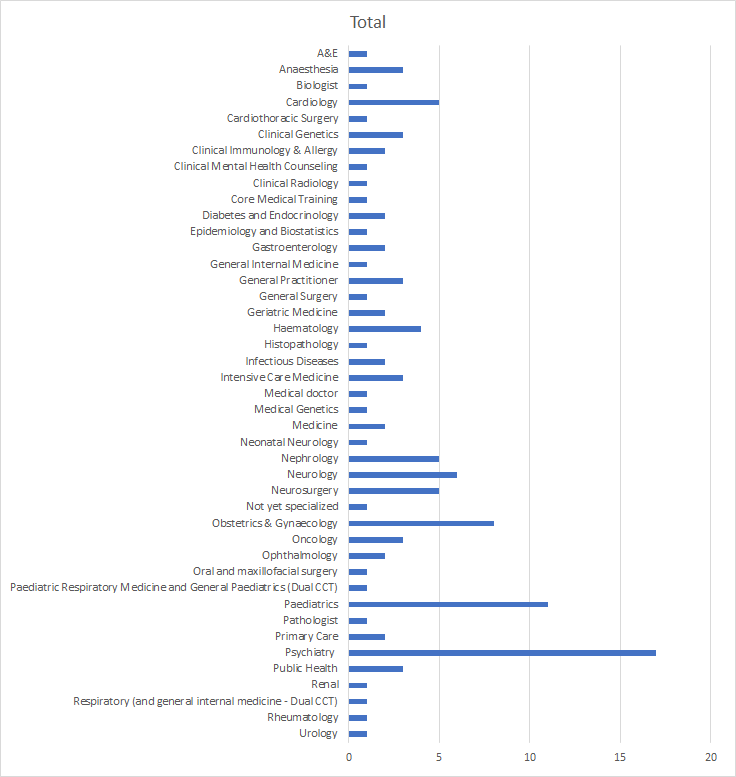
All statistics based on five recruitment cycles.